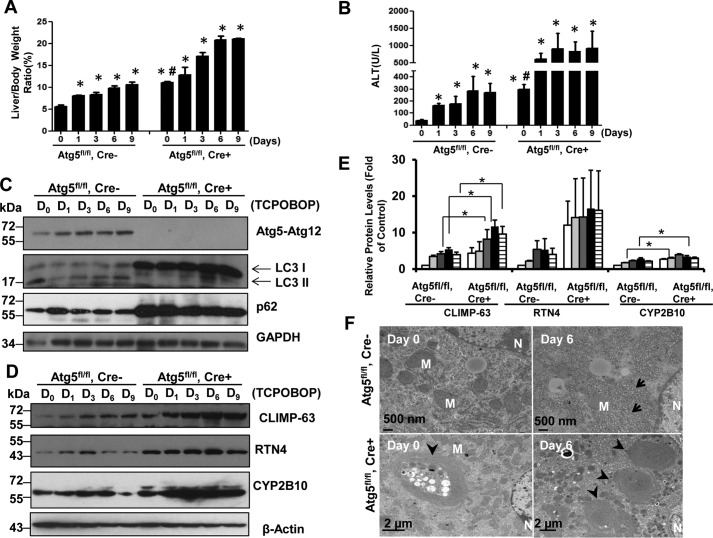
FIGURE 6.
Persistent accumulation of ER proteins in Li-Atg5 KO mice. Atg5 F/F, Cre+ (Li-Atg5 KO), and Atg5 F/F, Cre− mice were treated as in Fig. 1. A and B, ratios of liver to body weight (A) and serum ALT levels (B) were quantified. Data are presented as mean ± S.E. (n ≥ 3). *, p < 0.05 compared with the day 0 group (one-way ANOVA). #, p < 0.05 Atg5 F/F, Cre+ versus Atg5 F/F, Cre− mice (Student's t test). C–E, total liver lysates were subjected to immunoblot analysis (C and D) followed by densitometry analysis (E). All proteins were normalized to the loading control β-actin and are presented as -fold over vehicle control groups (mean ± S.E., n = 3). *, p < 0.05; one-way ANOVA. D, day. F, liver samples were processed for EM, and representative images are shown. Arrows, ER; arrowheads, aberrant ER membranes; M, mitochondrion; N, nucleus.

