FIGURE 4.
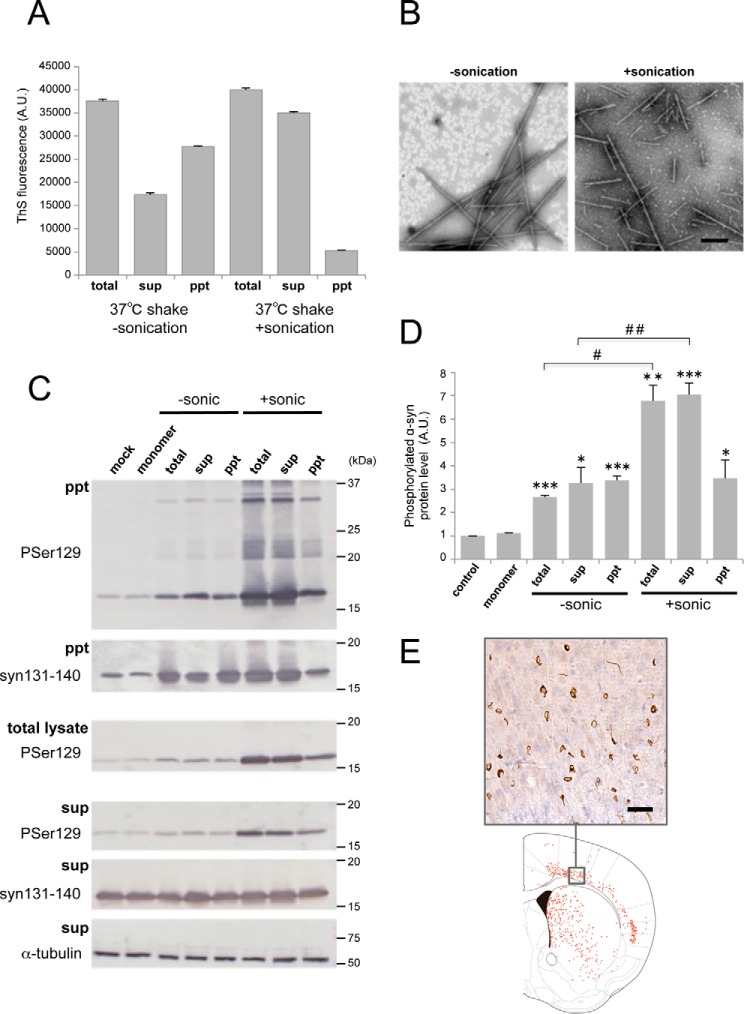
Seeding activities of α-syn fractions obtained by centrifugation. A, thioflavin S fluorescence of α-syn fibrils shaken (shake) at 37 °C for 7 days without or with sonication. Total α-syn (total) was fractionated into supernatant (sup) and pellet (ppt) by centrifugation. The results are expressed as mean ± S.E. (n = 3). B, electron microscopy of α-syn fibrils in supernatant after centrifugation without sonication (left panel) or with sonication (right panel). Scale bar = 200 nm. C, α-syn samples (2.5 μl) were introduced into SH-SY5Y cells overexpressing human α-syn. Immunoblot analysis of sarkosyl-insoluble fractions (ppt), total cell lysates (total), and sarkosyl-soluble fractions (sup) extracted from mock-transfected cells and cells transfected with α-syn monomer, α-syn samples without sonication (−sonic), total α-syn, supernatant, and pellet and α-syn samples with sonication (+sonic), total α-syn, supernatant, and pellet are shown. Phosphorylated α-syn was detected with anti-phosphorylated α-syn Ser(P)-129 antibody. α-Syn was detected with anti-syn 131–140 antibody. D, quantification of the immunoblot analysis shown in C. The results are expressed as mean ± S.E. (n = 3). *, p < 0.05; **, p < 0.01; ***, p < 0.001; Student's t test against the value of monomer. #, p < 0.01; ##, p < 0.001; Student's t test (without sonication versus with sonication). E, distribution of phosphorylated α-syn pathology in mouse brain. WT mouse brain was injected with supernatant after centrifugation of sonicated α-syn fibrils (10 μg) into striatum and observed 3 months later (n = 2). Phosphorylated α-syn pathology was evaluated by immunohistochemistry with Ser(P)-129 antibody. A typical image of brain (top panel) and a schematic of phosphorylated α-syn pathology (bottom panel) at the level of 0.62 mm from the bregma are shown. Red dots indicate phosphorylated α-syn pathology. Scale bar = 25 μm. A.U., arbitrary unit.

