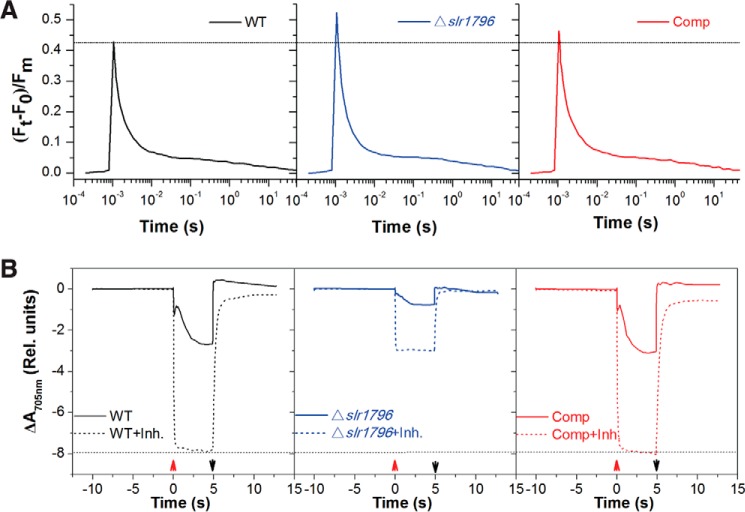
FIGURE 4.
Kinetic spectroscopic characterization of WT (black line), the Δslr1796 mutant (blue), and the complemented strain (red). Cells were suspended in BG11 to equal cell numbers at which WT cells were at a chlorophyll concentration of 5 μg/ml. A dotted line was drawn to facilitate comparisons between strains. Data are presented as the average of three biological replicates. A, reoxidation kinetics of the reduced PSII primary electron acceptor QA− in three strains. B, P700 redox kinetics in WT, Δslr1796 mutant, and Comp cells grown under the same conditions. After 10-s dark adaption, actinic light was turned on (up arrow) for 5 s and then off (down arrow) to allow the re-reduction of P700+ to P700. Inhibitors (Inh.; dotted lines), 10 μm DCMU and 10 μm 2,5-dibromo-6-isopropyl-3-methyl-1,4-benzoquinone, were added to inhibit linear and cyclic electron flow. A negative slope indicates P700 oxidation. Rel., relative.

