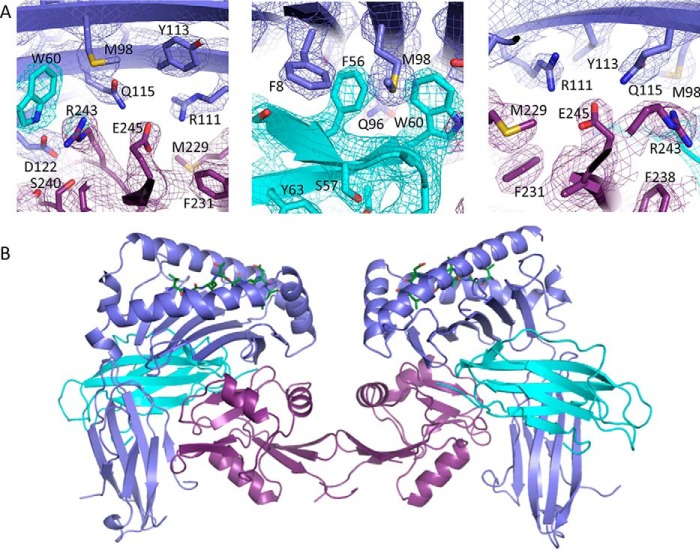
FIGURE 3.
Overview of the Ly49C H2-Q10 complex. A, the 2Fo − Fc electron density map is shown contoured at 1σ and colored according to chain (H2-Q10 (violet); β2M (cyan); Ly49C (magenta)). B, the Ly49C.H2-Q10 complex visible within the crystallographic asymmetric unit is shown in ribbon representation. Within the Ly49C homo-dimer (magenta), each Ly49C monomer interacts with one H2-Q10 molecule (H2-Q10 violet; β2m (cyan)).

