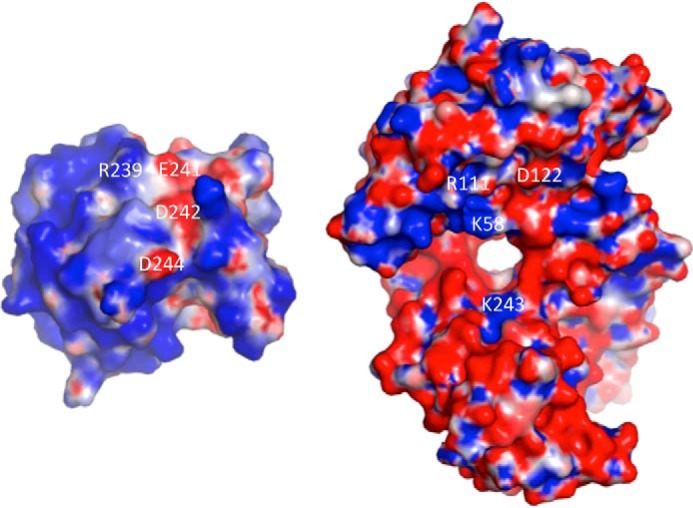
FIGURE 5.

The molecular surface at the Ly49C·H2-Q10 interface. Electrostatic complementarity at the Ly49C·H2-Q10 interface is shown. Positive surfaces of Ly49C (left) and H2-Q10 (right) are shown in red (−5 kiloteslas), neutral surfaces are in white (0 kiloteslas), and negative surfaces in blue (+5 kiloteslas). Charge potentials were calculated with APBS (42) and are visualized in PYMOL. Amino acid residues that form salt bridges between Ly49C and H2-Q10 are labeled.
