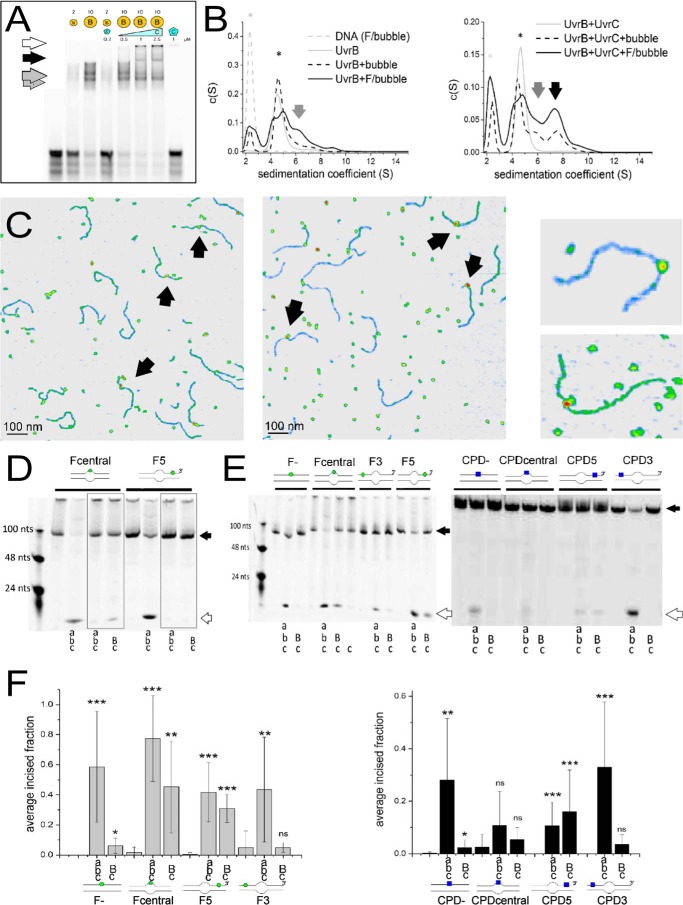
FIGURE 1.
UvrB(C)-DNA interactions. A, UvrB-DNA (gray arrows, monomer and dimer) and UvrBC-DNA (black arrow) complexes and UvrC-DNA aggregates (white arrow) on DNA containing a lesion in the context of a DNA bubble. B, AUC sedimentation coefficient spectra of UvrB-DNA (gray arrows), UvrBC-DNA (black arrow), UvrB and UvrBC (* in left and right plot, respectively, gray solid lines), and DNA alone (*, gray dashed line). Solid black lines indicate lesion containing DNA, dashed lines non-damaged DNA. C, AFM images of UvrB-DNA (left) and UvrBC-DNA (middle) complexes, indicated by arrows. Right representative complexes consistent with UvrB (top) and UvrB2 or UvrBC (bottom) size. D, DNA incision by Uvr(A)BC for fluorescein lesion containing DNA with a bubble as loading site either directly around (Fcentral) or at a distance 5′ from the lesion (F5), in the presence of ATP or ATPγS (gray boxes). E, Uvr(A)BC incisions of DNA containing either F (left) or CPD (right) in the context of completely duplexed DNA (F−, CPD−), directly within a DNA bubble (Fcentral, CPDcentral), or either 5′ or 3′ from a DNA bubble (F3, CPD3 or F5 and CPD5, respectively). As a control for nonspecific DNA incisions by the endonuclease, UvrC was also incubated alone with lesion DNA (shown only for the Fcentral substrate) but displayed no incision activity. Schematics of the DNA substrates are shown (F, green circle; CPD, blue square). Black arrows indicate the uncut DNA substrates and white arrows the incision products. F, statistical analyses of DNA incisions by Uvr(A)BC on different DNA substrates (as in E). Significance levels are given as follows: *, p < 0.05; **, p < 0.01, and ***, p < 0.005, n.s., not significant. Capital letters in D--F indicate high (2 μm) [UvrB]; small letters indicate low protein concentrations (20 nm UvrA, 200 nm UvrB, 50 nm UvrC).

