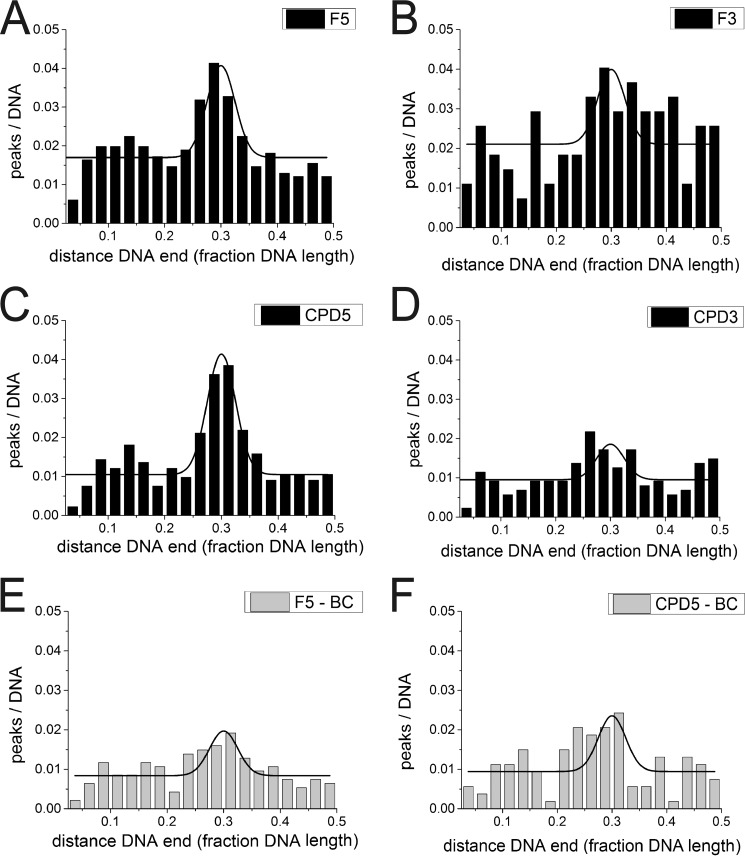
FIGURE 2.
AFM position distributions of UvrB and UvrBC on DNA lesion substrates. A–D, UvrB with F5 DNA (A), F3 DNA (B), CPD5 DNA (C), and CPD3 DNA (D). E and F, UvrBC (class 2, dimers only) with (E) F5 and F, CPD5 DNA. Position distributions are shown from 2.5% of DNA fragment length (excluding fragment ends) to 50% (center of the DNA substrate).

