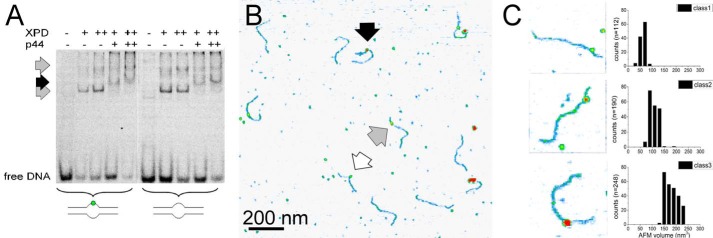
FIGURE 3.
XPD(/p44)-DNA interactions. A, EMSA of XPD and XPD/p44 binding to lesion containing and non-damaged DNA, as indicated (+, 1 μm; ++, 2 μm). Gray arrows indicate XPD-DNA, and the black arrow indicates XPD/p44-DNA complexes. B, AFM image of XPD/p44-DNA (black arrow) and XPD-DNA (gray arrow) complexes. The white arrow indicates a potential p44 complex or mere DNA superstructure. C, representative examples of the three different types of DNA bound complexes observed in the images, interpreted as p44, XPD, and XPD/p44 complexes based on their AFM volumes.

