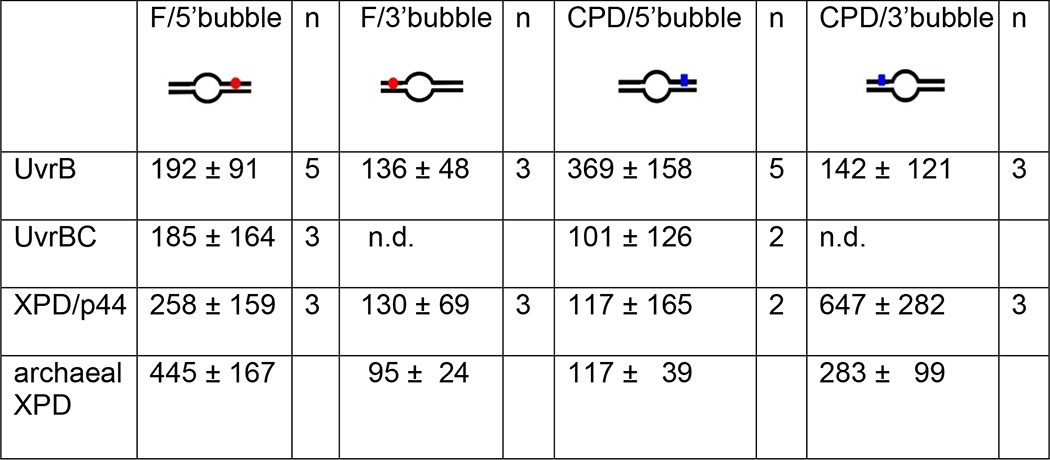
TABLE 2.
Lesion specificities of UvrB(C) and XPD(/p44) obtained from AFM imaging
Specificities were quantified from statistical analyses of protein position distributions on DNA containing a fluorescein adduct (F) or a CPD lesion in the context of a DNA bubble located either 5′ or 3′ from the lesion (see schematics). The specificities shown in the table are averages and standard deviations from n experiments. For comparison, specificities for archaeal XPD (without p44) are quoted from previously reported work (12). Position distributions of protein complexes on the different DNA substrates are shown in Figs. 2 and 4. ND means not determined.

