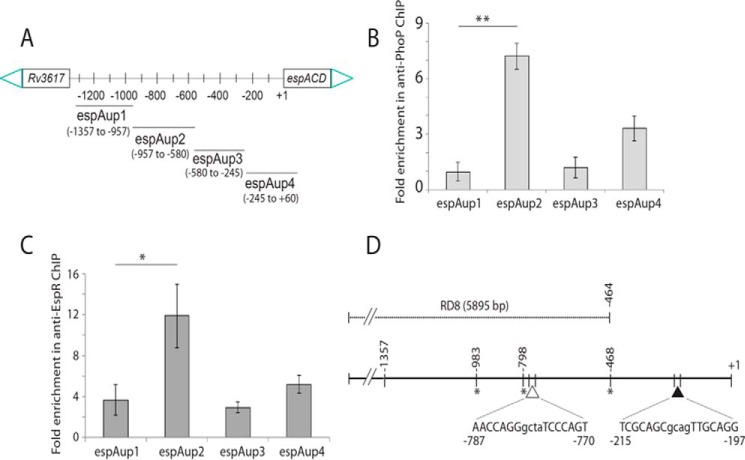
FIGURE 3.
Recruitment of PhoP and EspR at the espACD promoter. A, scheme showing organization of the espACD promoter divided into four fragments (espAup1–espAup4) to probe PhoP and EspR binding. Note that the promoter fragments espAup1–espAup4 span from −957 to −1357, −580 to −957, −245 to −580, and +60 to −245, respectively, relative to the start site of the ORF. To examine PhoP (B) and EspR (C) recruitment within the espACD promoter, ChIP-qPCR was carried out as described under the “Experimental Procedures.” Each data point represents mean of duplicate qPCR measurements using at least three independent M. tuberculosis cultures. Asterisk indicates a statistically significant difference in the ChIP enrichment level compared between espAup1 and espAup2 under the conditions examined (*, p < 0.05; **, p < 0.01). Note that the difference in the signal enrichment between PhoP and EspR antibodies may be attributable to affinity differences between proteins and/or respective antibodies. D, location of relevant protein-binding sites within espACD upstream regulatory region. Note that the EspR-binding sites, indicated by asterisks, are known to be centered around −468, −798, and −983 (relative to the start site of the ORF) (38), and the only reported PhoP-binding site shown by a filled triangle spans from −215 to −197 (37). However, the PhoP-binding site revealed in this study, shown by an empty triangle, spans from −781 to −770 based on sequence similarity with the consensus PhoP-binding motif (37). Importantly, the region upstream of −464, as shown in figure, constitutes part of RD8, including both the PhoP- and EspR-binding sites relevant to espACD activation.

