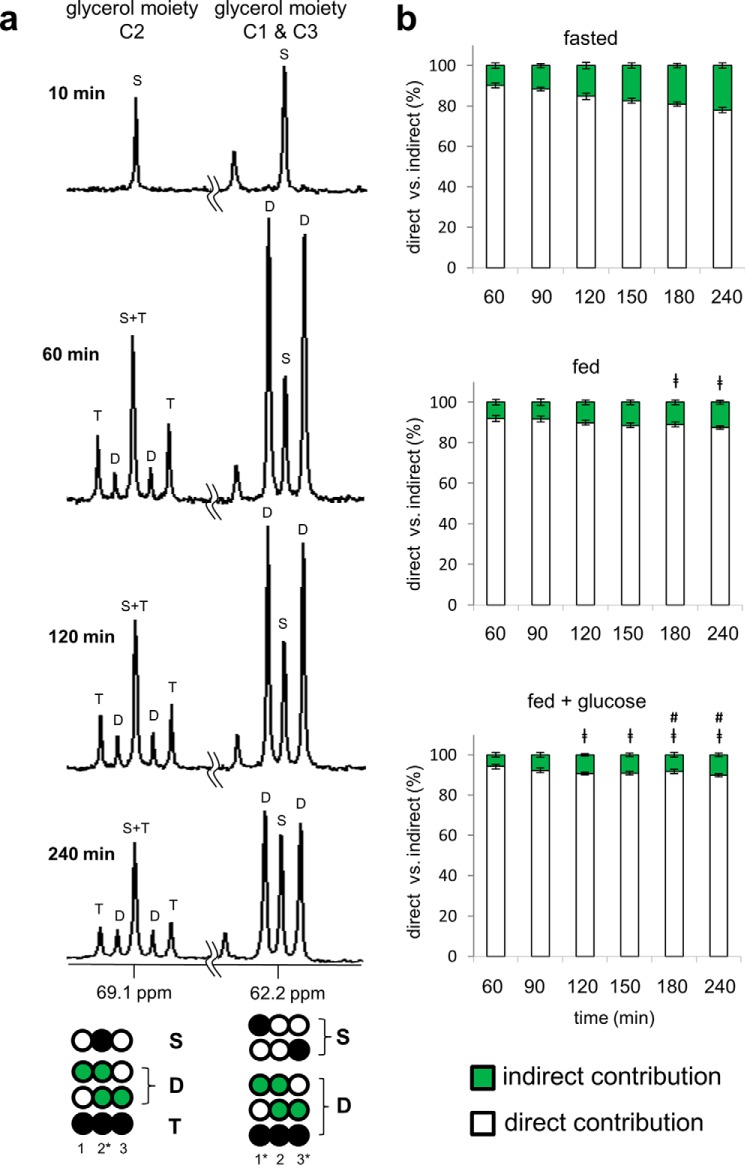
FIGURE 3.
13C NMR spectra of the glycerol moiety of TAGs reflect direct and indirect contributions from [U-13C3]glycerol. Healthy subjects ingested [U-13C3]glycerol under differing nutritional states, and blood was drawn at multiple times. a, 13C NMR spectra of lipid extracts from a fasted subject show the resonances of the glycerol backbones of TAGs. The spectrum from 10 min shows natural abundance 13C only, but the spectra from 60, 120, and 240 min show signals from excess 13C in the glycerol backbones. In the C1 and C3 region at 62.2 ppm, the doublet (D) reflects signals from [1,2-13C2]-, [2,3-13C2]-, and [U-13C3]glycerol moieties of TAGs. In the C2 region at 69.1 ppm, the doublet (D) reflects [1,2-13C2]- and [2,3-13C2]glycerol moieties, and the triplet (T) arises exclusively from [U-13C3]glycerol moiety. The presence of double-labeled glycerol demonstrates metabolism of [U-13C3]glycerol in the TCA cycle prior to glyceroneogenesis. b, the direct versus indirect contribution from [U-13C3]glycerol was estimated based on the analysis of the glycerol moiety C2 resonance. [U-13C3]Glycerol incorporation to TAGs occurred primarily via the direct pathway under all nutritional conditions. The indirect contribution through the TCA cycle was minor but increased gradually over time and was sensitive to nutritional states. The indirect contribution was 22% after a fast, 13% under a fed condition, and 10% under a fed plus glucose condition at 240 min of the ingestion. D, doublet from coupling of C1 with C2 or from coupling of C2 with C3; T, triplet arising from coupling of C2 with both C1 and C3; S, singlet. Open circles, 12C; black circles, 13C; green circles, 13C after metabolism through the TCA cycle. ‡, p < 0.05 compared with the corresponding time point under a fasted state; #, p < 0.05 compared with the corresponding time point under a fed state (n = 6).

