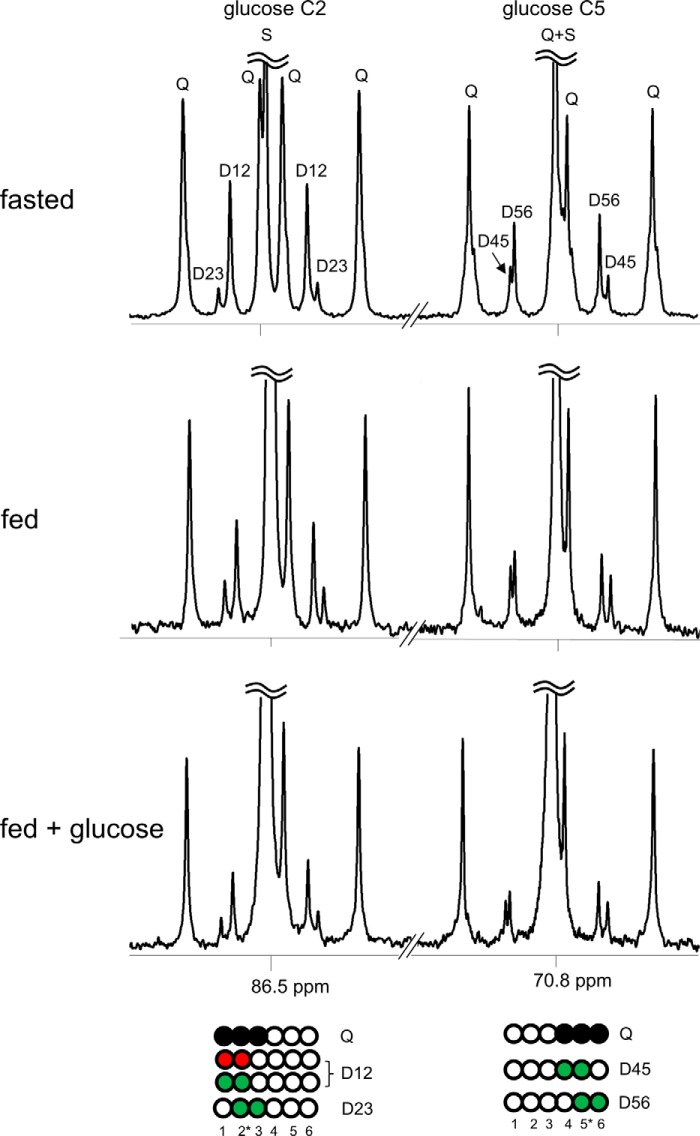
FIGURE 5.
13C NMR spectra of plasma glucose reflect hepatic gluconeogenesis and PPP activity. A subject ingested [U-13C3]glycerol under differing nutritional states, and blood was drawn at multiple times. Glucose was derivatized for 13C NMR acquisition, and the spectra are from blood drawn at 180 min after [U-13C3]glycerol ingestion. Gluconeogenesis directly from [U-13C3]glycerol produced [1,2,3-13C3]- and [4,5,6-13C3]glucose. [U-13C3]Glycerol metabolism through the TCA cycle prior to gluconeogenesis produced double-labeled glucose ([1,2-13C2], [2,3-13C2], [5,6-13C2], and [4,5-13C2]). Hepatic PPP activity produced additional [1,2-13C2]glucose, which was greatest under a fast. The ratio difference between D12/D23 versus D56/D45 (i.e. [1,2-13C2]/[2,3-13C2] versus [5,6-13C2]/[4,5-13C2] in glucose) reflects hepatic PPP activity, which was sensitive to nutritional states. D12, doublet from coupling of C1 with C2; D23, doublet from coupling of C2 with C3; Q, doublet of doublets, or quartet, arising from coupling of C2 with both C1 and C3 or from coupling of C5 with both C4 and C6; D45, doublet from coupling of C4 with C5; D56, doublet from coupling of C5 with C6; S, singlet. Open circles, 12C; black circles, 13C; green circles, 13C after metabolism through the TCA cycle; red circles, 13C after metabolism through the PPP.

