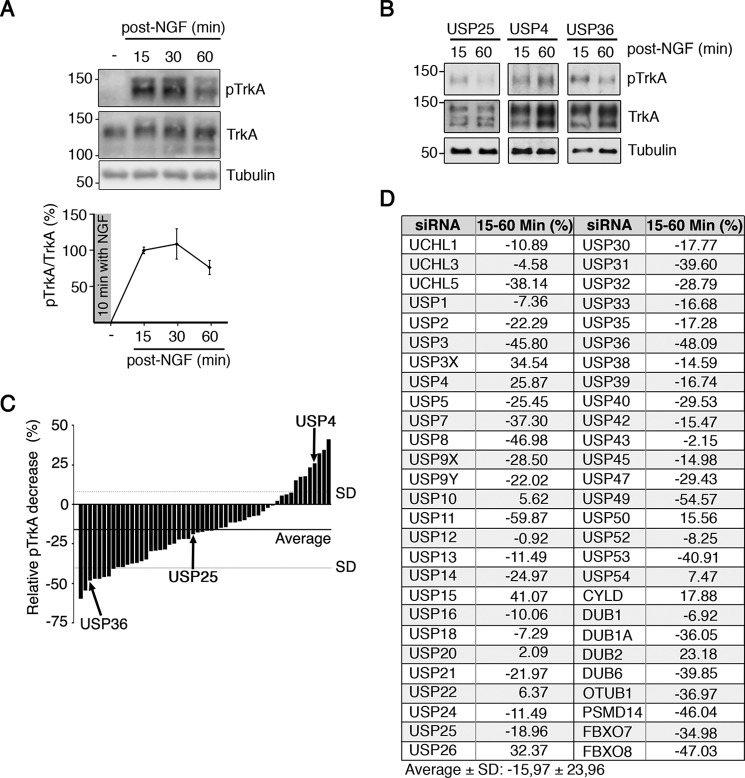
FIGURE 1.
Screening to identify DUBs regulating TrkA activation in response to NGF. A, kinetics of TrkA activation after a 10-min pulse of NGF. PC12-6/15 cells were serum-starved overnight, and the next morning NGF (100 ng/ml) was added for 10 min. Then fresh medium without NGF was added to the cells, and the samples were collected after 15, 30, and 60 min. Western blotting analyses were performed to detect active TrkA (pTrkA) and total TrkA. Tubulin was used as a loading control. Graph showing pTrkA activation in response to NGF (n = 3). B, Western blotting showing pTrkA activation in response to NGF in cells expressing USP36, USP25, and USP4 siRNAs. PC12-6/15 cells were transfected with individual pools of the DUB siRNA library. The cells were treated with NGF for 10 min, and samples were collected 15 and 60 min after NGF removal. TrkA levels are shown. Tubulin was used as a loading control. C, graph showing the relative decrease of TrkA activation after NGF treatment between 15 and 60 min in response to DUB depletion from two independent experiments. The horizontal and dotted lines indicate the averages and standard deviations, respectively, of the results obtained for all the genes assessed. The bars corresponding to TrkA activation average from USP36, USP25, and USP4 depleted cells are indicated. D, list of genes and quantification of the screening showing the means ± standard deviation of TrkA activation from all assessed DUBs.

