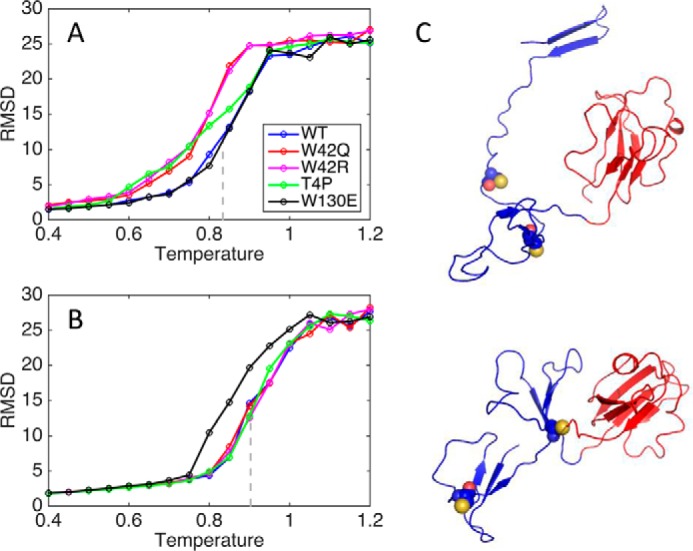
FIGURE 4.

RMSD from native structure for N- and C-terminal domains. RMSD was averaged over 50 simulations at step 60,000,000. The gray line shows the midpoint of the sigmoidal fit to the WT curve. A, N-terminal domain. B, C-terminal domain. C, representative W42R structures populated at T = 0.800 with N-terminal domains in blue and C-terminal domains in red. Cys32 and Cys41 are shown as space-filling models.
