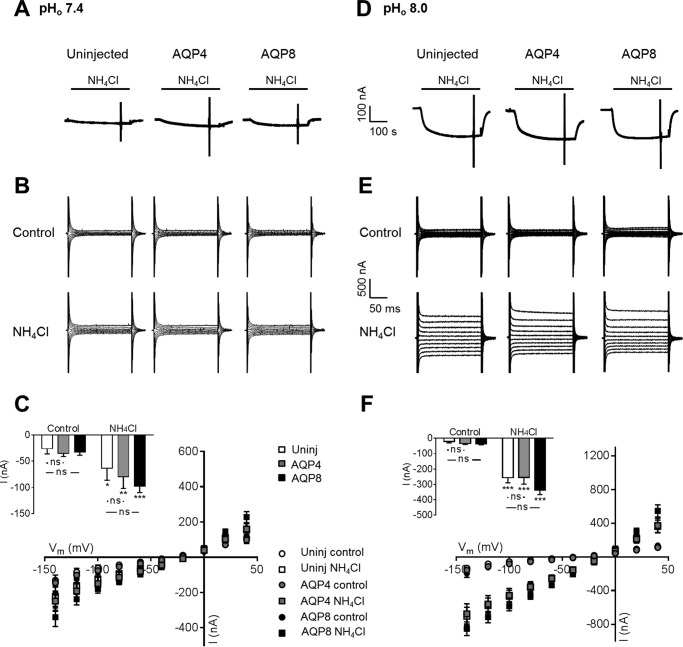
FIGURE 4.
No aquaporin-mediated NH4+ permeation. A and D, representative current traces in uninjected (left panel), AQP4 (middle panel)-, and AQP8 (right panel)-expressing oocytes at pHo 7.4 (A) and pHo 8.0 (D) before and in the presence of 5 mm NH4Cl, marked with a black bar. The currents were recorded from single oocytes at a holding potential of −50 mV. B and E, representative I/V relationships of uninjected (left panels), AQP4 (middle panels)-, or AQP8 (right panels)-expressing oocytes at pHo 7.4 (B) and pHo 8.0 (E) before and after 5 min of treatment with 5 mm NH4Cl. C and F, summarized I/V relationships of uninjected (Uninj.) oocytes (white) and oocytes expressing AQP4 (gray) or AQP8 (black) before and after treatment with 5 mm NH4Cl at pHo 7.4 (C) and pHo 8.0 (F), n = 9 of each, with the currents obtained at Vm = −60 mV summarized in the insets. Statistical significance was determined with two-way analysis of variance with Šídák's multiple comparison post hoc test. *, p < 0.05; **, p < 0.01; ***, p < 0.001; ns, not significant.

