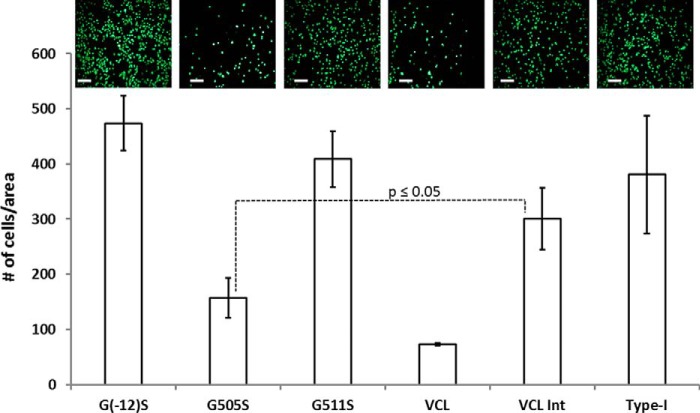
FIGURE 5.
HT1080 cell adhesion assay shows the in vitro binding profile of recombinant proteins with and without mutations. Live imaging (shown on top) was performed after calcein-AM staining of bound cells. Scale bars, 50 μm. Quantitative analysis for the cell attachment was performed by ImageJ. Experiments were carried out in triplicate with error bars representing the standard deviation and statistical analysis performed with the paired t test. G505S had a statistically significant decrease in cell adhesion compared with VCL-Int (p ≤ 0.05).

