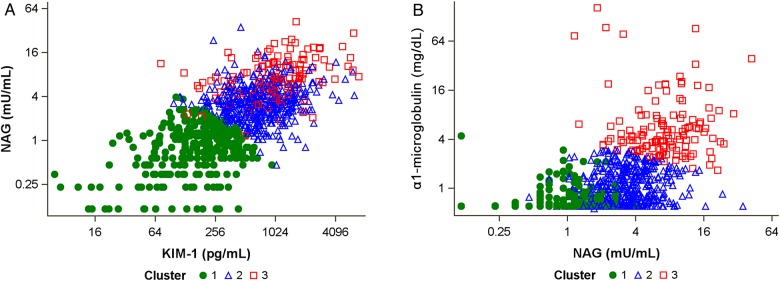
FIGURE 2:
Comparison of distinguishing urine biomarkers by cluster membership. (A) Scatterplot shows separation of Cluster 1 from Clusters 2 and 3 by NAG and KIM-1. (B) Scatterplot shows separation of Cluster 3 from Clusters 1 and 2 by NAG and α1m. Note that clusters were derived from NAG, KIM-1 and α1m, independent of study outcomes.

