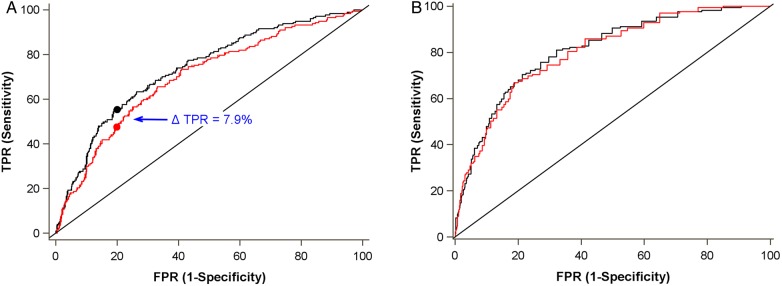
FIGURE 3:
Comparison of receiver operator characteristic curves for (A) incident CKD and (B) all-cause mortality. Red line denotes traditional model and black line denotes traditional model plus biomarker cluster. Traditional models control for age, race, hypertension, diabetes mellitus, hepatitis C virus infection, HIV viral load and CD4 lymphocyte count. Mortality model adjusts additionally for eGFR calculated using cystatin C. (A) At a false positive rate (FPR) of 20%, the true positive rate (TPR) is 55.4% with the biomarker cluster versus 47.5% without the biomarker cluster. Overall c-statistic is 0.76 with the biomarker cluster and 0.72 without the biomarker cluster. (B) Overall c-statistic is 0.80 with the biomarker cluster and 0.79 without the biomarker cluster.

