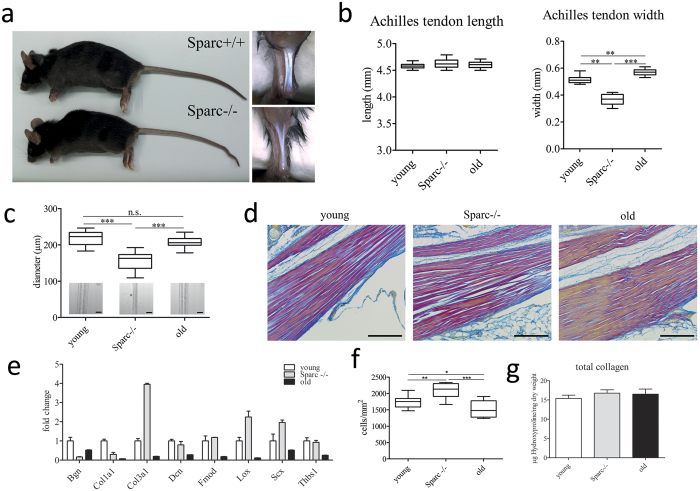
Figure 2. Characterization of C57BL/6 Sparc−/− tendons.
(a,b) Phenotype of wild type and Sparc−/− C57BL/6 mice and Achilles tendons. Sparc−/− mice are similar in size and body weight. Achilles tendons of Sparc−/− mice are significantly thinner, but not shorter compared to their wild type counterparts (n = 10 for each group). ***P < 0.001, **P < 0.01, One-way ANOVA (Tukey’s Multiple Comparison Test). (c) Similarly, tail tendon fascicles of Sparc−/− mice are thinner, whereas no differences were detectable between the fascicle diameters of young and healthy-aged tail tendons. Shown are measurements of 10 tail tendon fascicles of 10 individuals each (n = 100). ***P < 0.001, **P < 0.01, *P < 0.05 non-parametric repeated Measures ANOVA (Friedman Test with Dunn’s post hoc test). (d) Herovici’s collagen stain of young, Sparc−/−, and healthy-aged mouse Achilles tendons showing collagen type I in red and Collagen type III in blue (scale bar: 200 μm). (e) Gene expression analysis of ECM-related genes in Achilles tendon tissue. Shown is fold-change in expression compared to young tendon tissue. The expression of Col3a1 mRNA is up-regulated in Sparc−/−, leading to a shift in the ColI/ColIII ratio (Figure S2). (f) Determination of total cell number per area in young and Sparc−/− Achilles tendons, showing a significant enhanced cell number in Sparc−/− tendons. Data information: Boxplots represent cell counts determined for Achilles tendons harvested from 10 mice. A minimum of 1000 cells per animal were counted. ***P < 0.001, **P < 0.01, *P < 0.05 One-way ANOVA (Tukey’s Multiple Comparison Test). (g) Total Collagen content determined by the hydroxyproline content of tail tendons extracted from the three groups. Graphs represent quantifications of 3 independent biological repeats (mean ± SEM).

