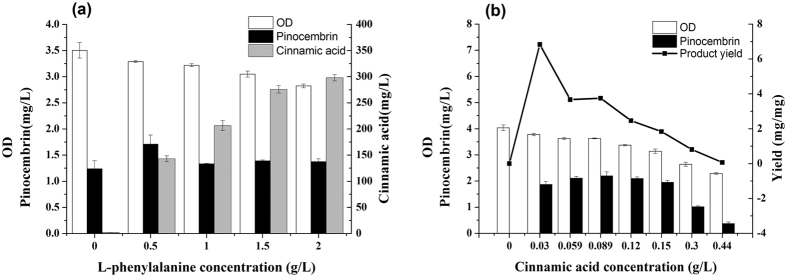
Figure 2. The effect of L-phenylalanine or cinnamic acid supplement on biomass and product distribution.
(a) The engineered strain carrying pET-YEPAL-SE4CL and pRSF-CHS-CHI cultured with different L-phenylalanine concentration ranging from 0 g/L to 2 g/L. Black bars: pinocembrin (mg/L); gray bars: cinnamic acid (mg/L); white bars: OD600. (b) The engineered strain carrying pET-SE4CL and pRSF-CHS-CHI cultured with different cinnamic acid concentration ranging from 0 g/L to 0.44 g/L. Black bars: pinocembrin (mg/L); gray bars: cinnamic acid (mg/L); black line: the pinocembrin yield (mg/mg). The error bars indicate the standard deviation, as determined from triplicate experiments (three independent bacterial cultures).

