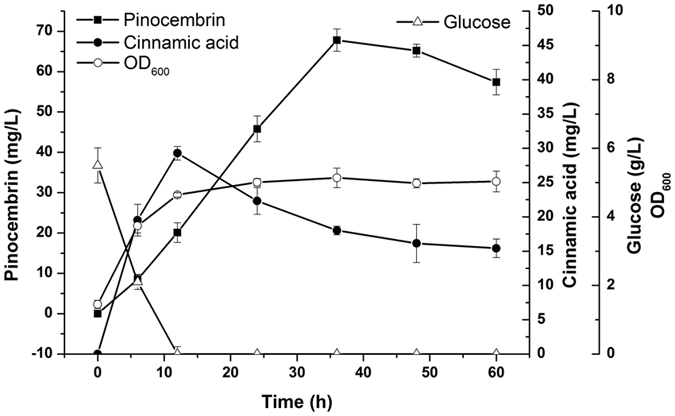
Figure 6. Time course of the changes in the OD600, glucose level and the production of pinocembrin and cinnamic acid during two-phase batch fermentation.

Symbols used in the figure are as follows: OD600 (empty circles), glucose (empty triangles), cinnamic acid (filled circles) and pinocembrin (filled squares). The error bars indicate the standard deviation, as determined from triplicate experiments (three independent bacterial cultures).
