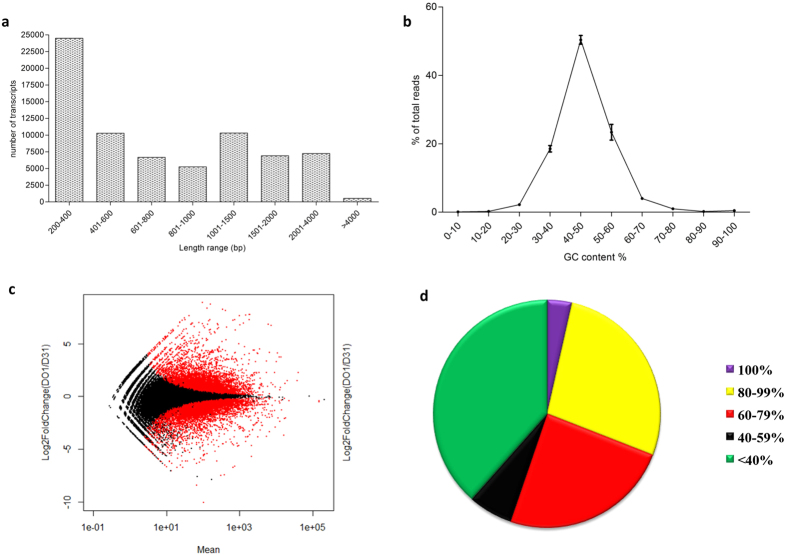
Figure 2. General features of “Dashehari” transcriptome.
(a) Length distribution of M. indica transcripts from the combined assembly. (b) GC content distribution. (c) Fold change and mean plot between unripe inner zone and midripe inner zone samples using DESeq program. The transcripts with p-value < 0.01 are shown in red. (d) Blastx similarity score distribution of “Dashehari” transcriptome with NR database.

