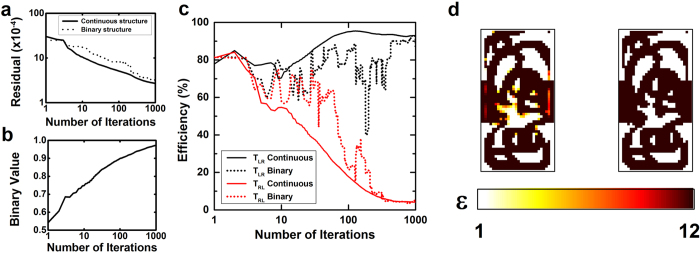
Figure 2.
Physics residual (a), binary value (b) and transmission efficiencies for both direction incidences (c) of the designs computed by the objective-first inverse design algorithm as a function of the number of iterations. Figures of merit from the continuous and binary structures are respectively shown in solid and dotted lines. (d) Color maps of the continuous (left) and binary (right) structures calculated by the inverse-design algorithms after 1000 iterations. Each structure is composed of 30 × 60 pixels, where the color shows the computed permittivity, between 1 (air) and 12 (Silicon).

