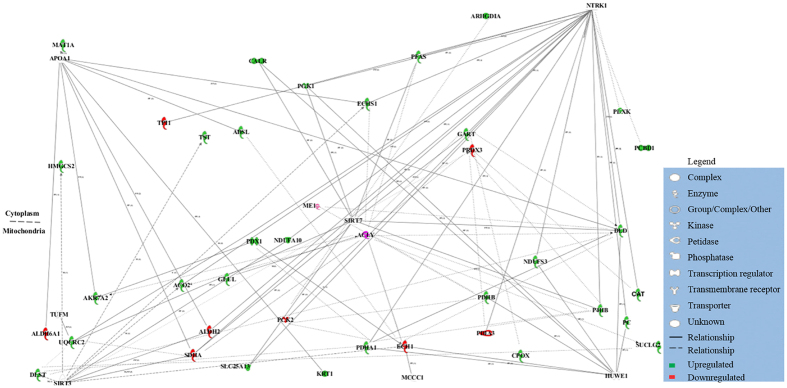
Figure 5. Canonical pathway built using 66 differentially expressed proteins.
The network was created using Ingenuity Pathway Analysis. Red indicates that the expression of the corresponding protein was downregulated, and green indicates that the expression of the corresponding protein was upregulated in the liver of broiler chickens that were given (-)-HCA. The full and dashed lines represent direct and indirect interactions between the proteins, respectively. Network shapes are explained in the legend.

