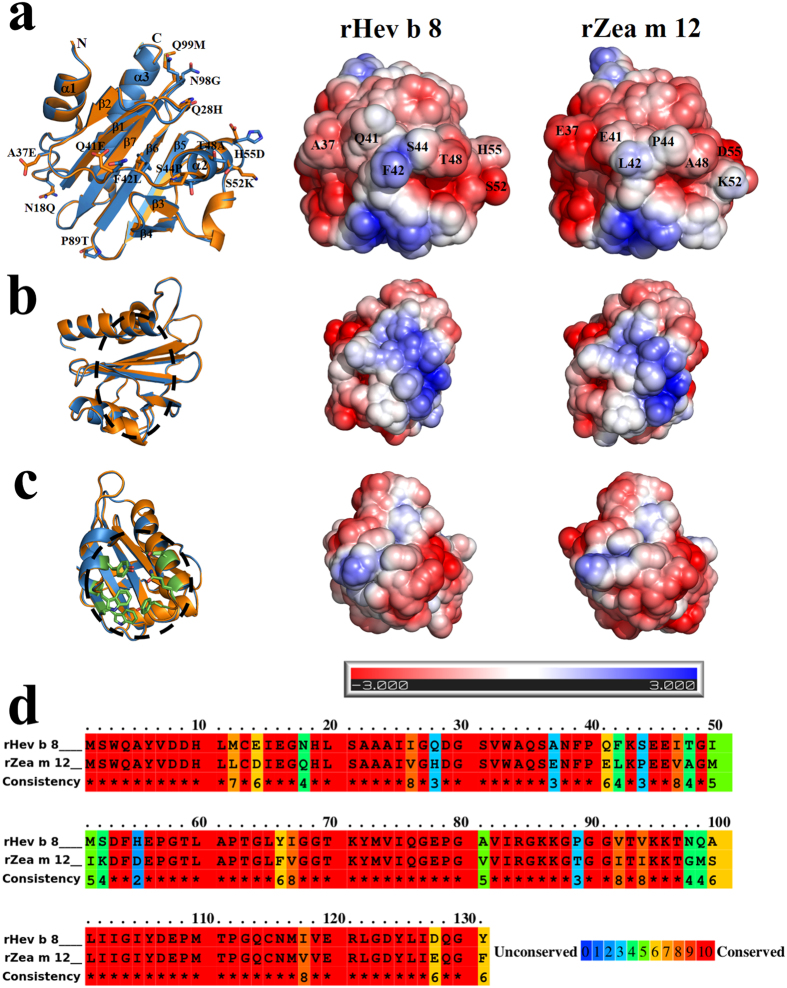
Figure 1. Structural comparisons of rHev b 8 and rZea m 12.
(a) Three-dimensional alignment of rHev b 8 (blue) and rZea m 12 (orange) reveals a high structural similarity (rmsd 0.27 Å); sticks show residues that differ between the chains. The two right figures show the surface electrostatic potential of both allergens, depicting different side chains of the loop (residues Ala37 to His55 in rHev b 8 and Glu37 to Asp55 in rZea m 12). (b) On the left, Cα alignment of rHev b 8 and rZea m 12 showing the region of actin interaction (dashed circle); on the right, the surface electrostatic potential of both allergens in this region. (c) On the left, Cα alignment of rHev b 8 and rZea m 12 depicting residues involved in the poly-proline binding site (green sticks), and the comparison of the surface electrostatic potentials on the right. (d) Amino acid sequence alignment between rHev b 8 and rZea m 12, conserved residues are shown as a gradient from red to blue.

