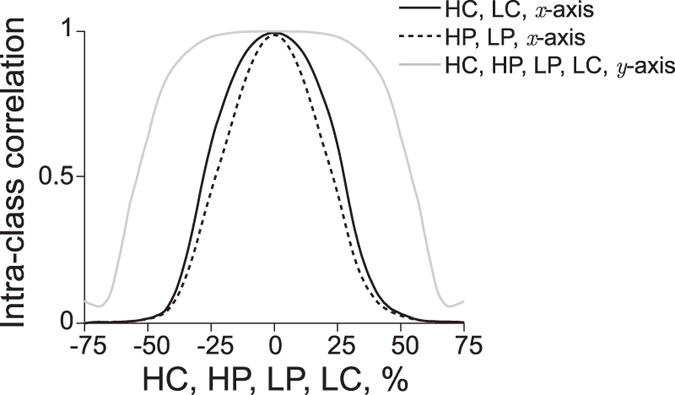
Figure 5. Evolution of intra-class correlation coefficients (ICC) from electrical impedance myography (EIM) test-retest data.

The consequence of an increasing uncertainty positioning the electrodes is a decrease in EIM’s ICC values. ICC values in the x-axis: high current, solid gray; high potential, dotted black; low potential, dashed black; low current, dashdot black. In the y-axis, the ICC values are the same for all the electrodes, shown in dashed gray. We refer the reader to Table 4 for the numerical values. Electrodes nomenclature: HC, high current; HP, high potential; LP, low potential; LC, low current.
