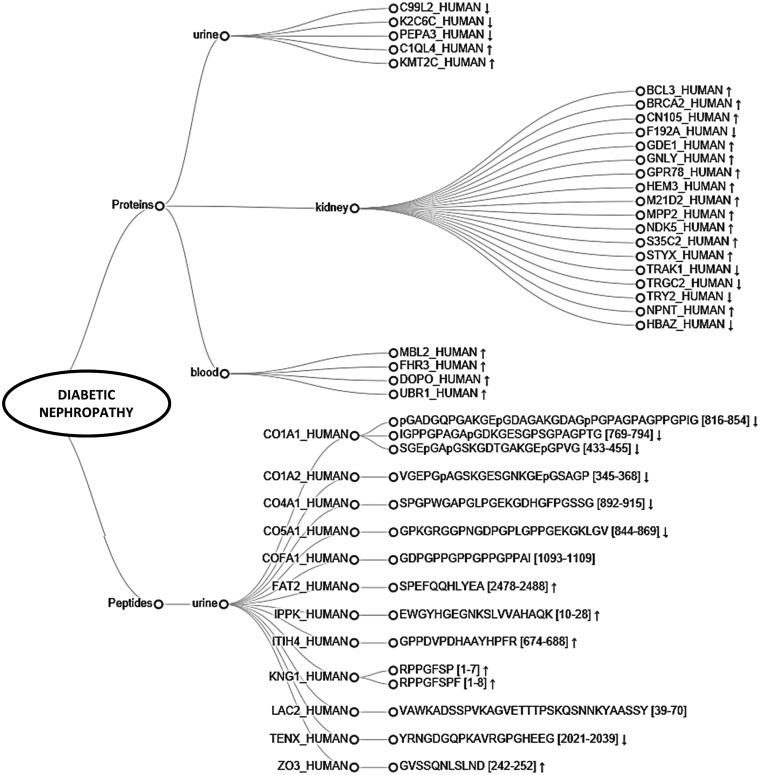
Figure 6.
Dendrogram representing peptides and proteins found differentially expressed in different sample types (urine, blood, kidney) and identified as uniquely associated with diabetic nephropathy (DN). Arrows represent reported regulation between cases and controls (↑ -upregulation, ↓ -downregulation).

