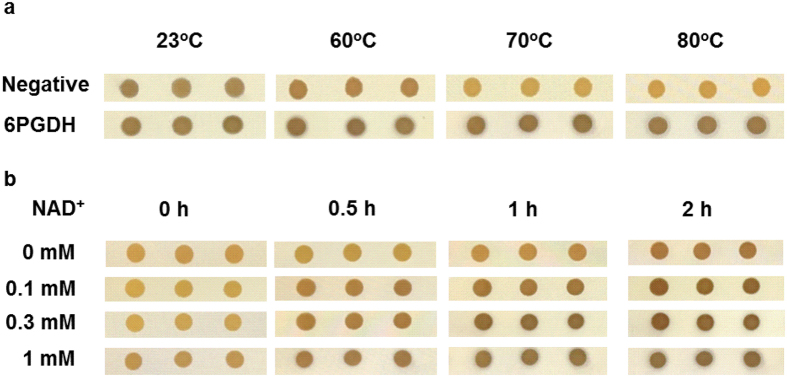
Figure 4. Optimization of heat treatment temperature and color development time.
(a) Optimization of heat-treatment temperature for screening. E. coli TOP10 (pET28a-Ptac) was a negative control while E. coli TOP10 (pET28a-Ptac-6pgdh) was a positive control. Colonies were treated at 23, 60, 70 and 80 °C for 1 h, respectively. The color changes of the colonies overlaid by the second agarose layer were examined. (b) Optimization of color development time and NAD+ concentration. Heat-treated colonies of E. coli TOP10 (pET28a-Ptac-6pgdh) was overlaid by the second layer containing 0, 0.1, 0.3 or 1 mM NAD+. The color change profiles of colonies were photographed at 0, 0.5, 1 and 2 h.

