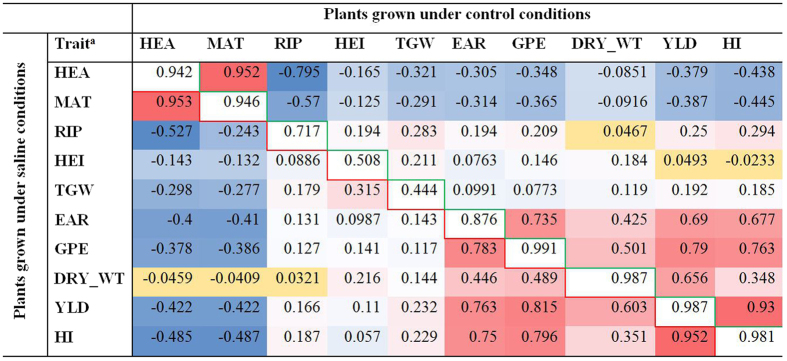
Figure 2. Pearson correlations between the ten studied traits.
Correlations under control conditions are above the diagonal and correlations under saline conditions are below the diagonal. A heat map is used to color these correlations: blue indicates negative correlations, red indicates positive correlations, and the color intensity indicates the strength of the correlation (the darker the color the stronger the correlation). Within trait correlations between control and saline conditions are placed on the diagonal axis (white cells). All correlations are significant (p < 0.05) except for those in the yellow cells.aFlowering time (HEA), maturity time (MAT), ripening period (RIP), plant height (HEI), thousand grain mass (TGW), ear number per plant (EAR), grain number per ear (GPE), dry mass per m2 (DRY_WT), yield (YLD), and harvest index (HI).

