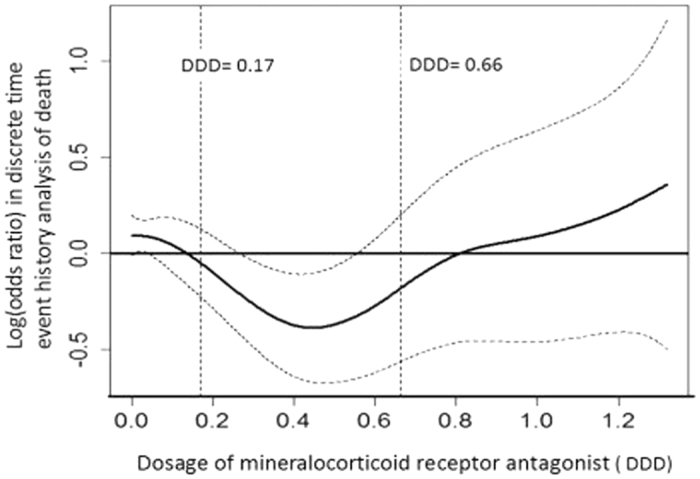
Figure 4. The function curve with values of the logs of odds ratios from the GAM model with splines regarding MRA for our multilevel discrete-time event history analysis of risk of death among PA patients.

The curve was centered to have an average of zero over the range of the data. The dashed lines indicated approximated point-wise 95% CIs. (Abbreviations: CI, confidence interval; DDD, defined daily dose; GAM, generalized additive model; MRA, mineralocorticoid receptor antagonist; PA, primary aldosteronism) (The DDD of MRA is 0.17 (12.5 mg of spironolactone) and 0.66 (50 mg spironolactone).
