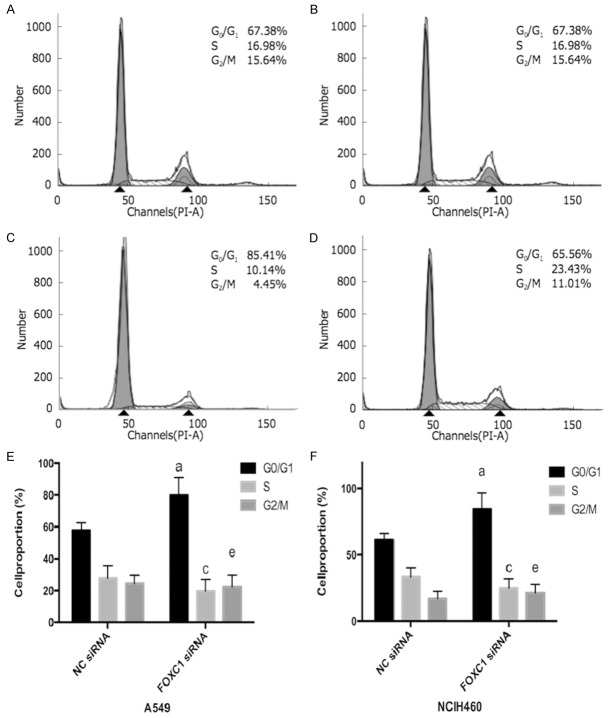
Figure 5.
NSCLC cell cycle distribution after FOXC1 gene silencing detected by flow cytometry. A: A549 negative control group; B: A549 FOXC1 siRNA group; C: NCIH460 negative control group; D: NCIH460 FOXC1 siRNA group; E: A549 cell cycle distribution; F: NCIH460 cell cycle distribution. aP<0.05 vs. NC siRNA G0/G1 phase; cP<0.05 vs. NC siRNA S phase; eP<0.05 vs. NC siRNA G2/M phase.

