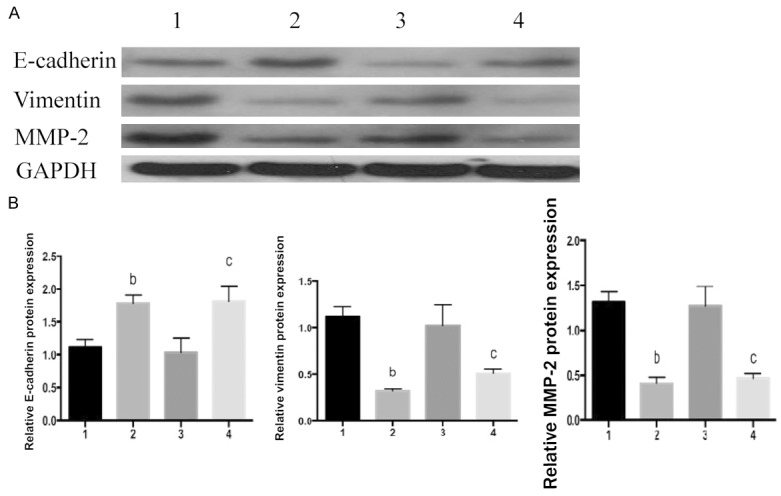
Figure 8.

Effects of FOXC1 gene silencing on proteins related to cell migration. A: Western blot results; B: E-cadherin, vimentin and MMP-2 protein expressions, 1: A549 negative control group; 2: A549 FOXC1 siRNA group; 3: NCIH460 negative control group; 4: NCIH460 FOXC1 siRNA group. bP<0.01 vs. A549 negative control group; cP<0.05 vs. NCIH460 negative control group.
