
Figure 3.
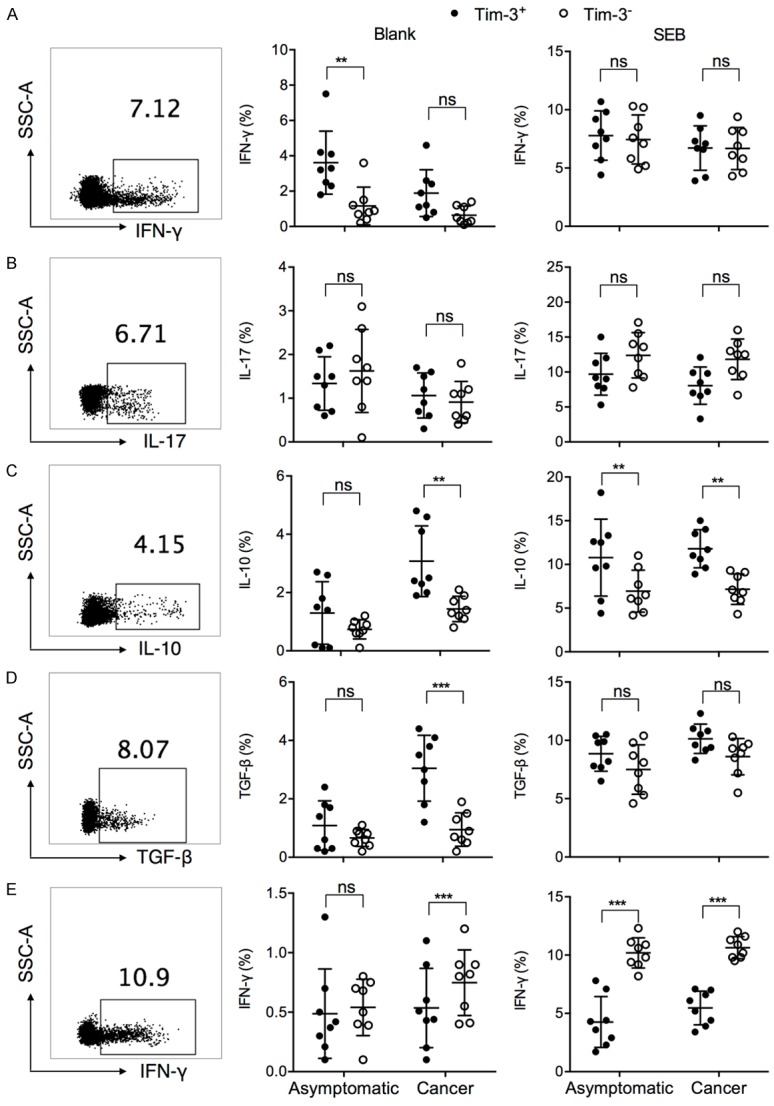
Signature cytokine expression by Tim-3+ vs. Tim-3- cells in each T cell subset, in asymptomatic subjects and gastric cancer patients. PBMCs from asymptomatic subjects or cancer patients were incubated in plain medium (blank) or with 2 µg/mL SEB for 12 h, in the presence of brefeldin A and monensin. The (A) IFN-γ expression by Th1, (B) IL-17 by Th17, (C) IL-10 and (D) TNF-β by Treg, (E) and IFN-γ by CD8+ T cells were examined in flow cytometry, by first gating on each T cell subset and then examining the percentage of cytokine-expressing cells. Representative intracellular staining of each cytokine was shown using sample from one cancer patient. t test with Welch’s correction. **P < 0.01. ***P < 0.001. ns: not significant.