
Figure 1.
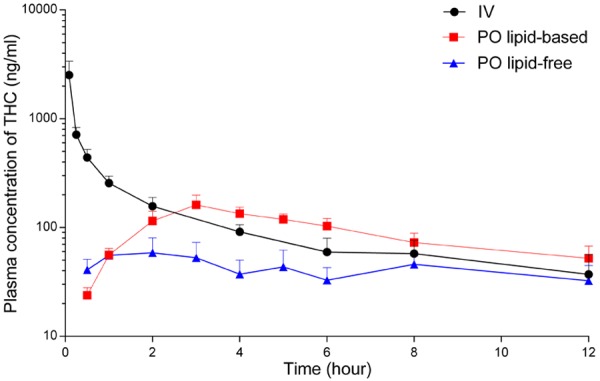
Plasma concentration-time profiles of Δ9-tetrahydrocannabinol (THC) following IV bolus (4 mg/kg, n = 5), oral lipid-free formulation (12 mg/kg, n = 6), and oral long-chain triglyceride (LCT)-based formulation (12 mg/kg, n = 5) to rats. The data are shown as mean ± SEM.