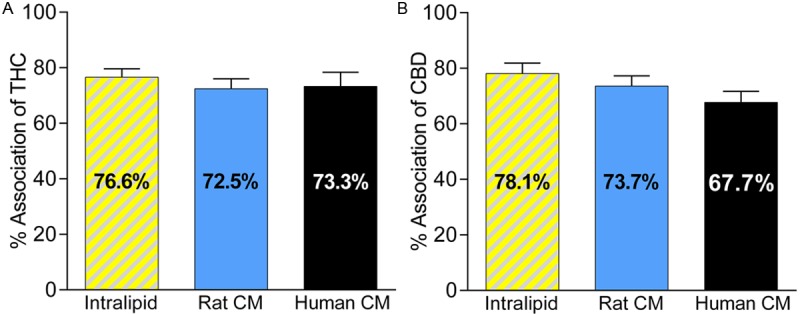
Figure 4.

Panel A: Uptake of Δ9-tetrahydrocannabinol (THC) by lipid particles (from Intralipid®, n = 6) and plasma derived chylomicrons (CM) isolated from rats (n = 5) or humans (n = 6). Panel B: Uptake of cannabidiol (CBD) by lipid particles (n = 9) and plasma derived CM isolated from rats (n = 7) or humans (n = 5). The data are shown as mean ± SEM of % association. One-way ANOVA with Tukey’s post-hoc test was used for statistical analysis. Differences between data sets were statistically non-significant.
