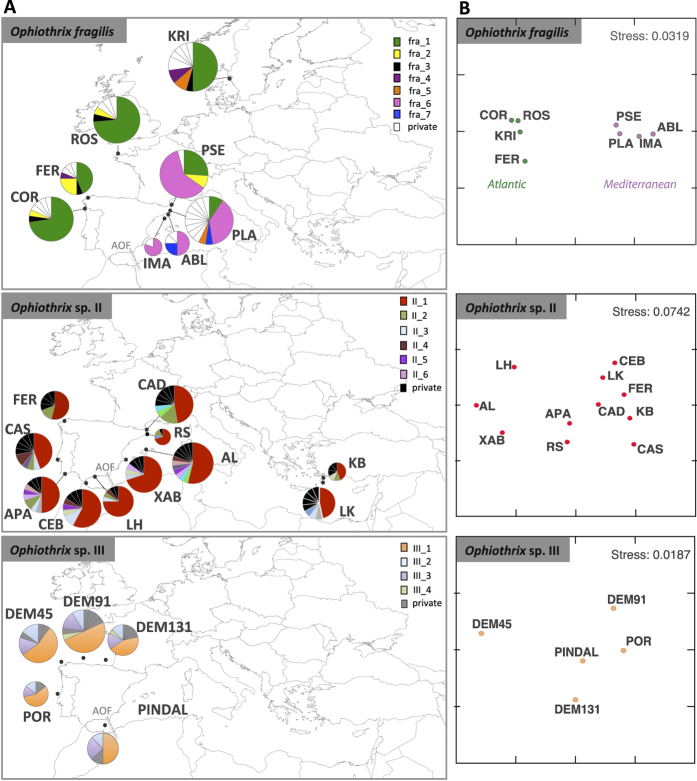
Figure 1.
(A) Map of the Atlantic-Mediterranean area showing the locations where samples of Ophiothrix fragilis, Ophiothrix sp. II, and Ophiothrix sp. III were collected. See Table 1 for further details about locations. Circles represent the 16S haplotype diversity within each location and their size is proportional to the number of individuals per site. Partitions inside the circles represent the relative proportion of each haplotype within each location. The dashed-grey line represents the Almeria-Oran Front (AOF). See Fig. 2 for details about haplotypes for each species. (B) MDS representation of the ФST values at each location for each of the three species. Figures were created with the free software QGIS (http://qgis.osgeo.org/es/site/), and edited in Adobe Illustrator CS5.1 (http://www.adobe.com) for this study.

