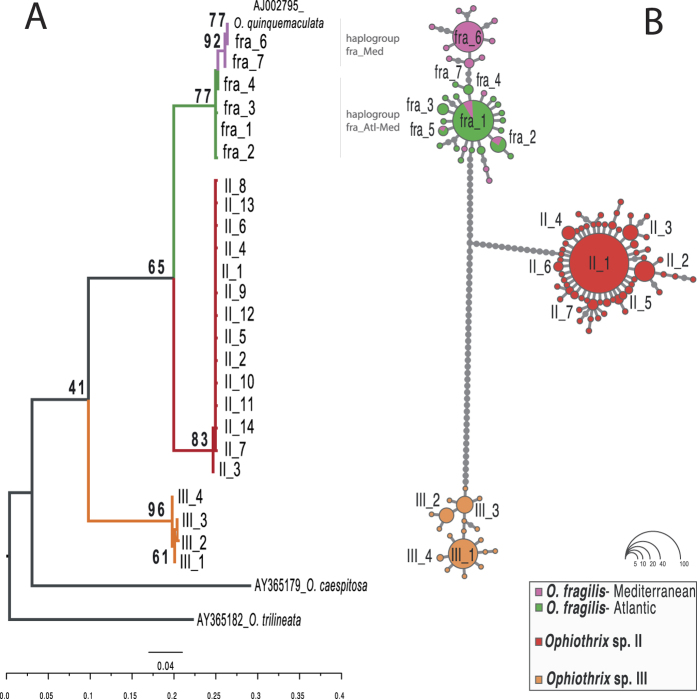
Figure 2.
(A) Maximum Likelihood phylogenetic tree of the most frequent haplotypes of three species of Ophiothrix resulting from the 16S marker. Only bootstrap support values >40 are indicated in the main nodes. (B) Haplotype network for the three Ophiothrix species based on the complete 16S alignment. Circles are proportional to the number of individuals per haplotype. Grey dots correspond to mutational steps.

