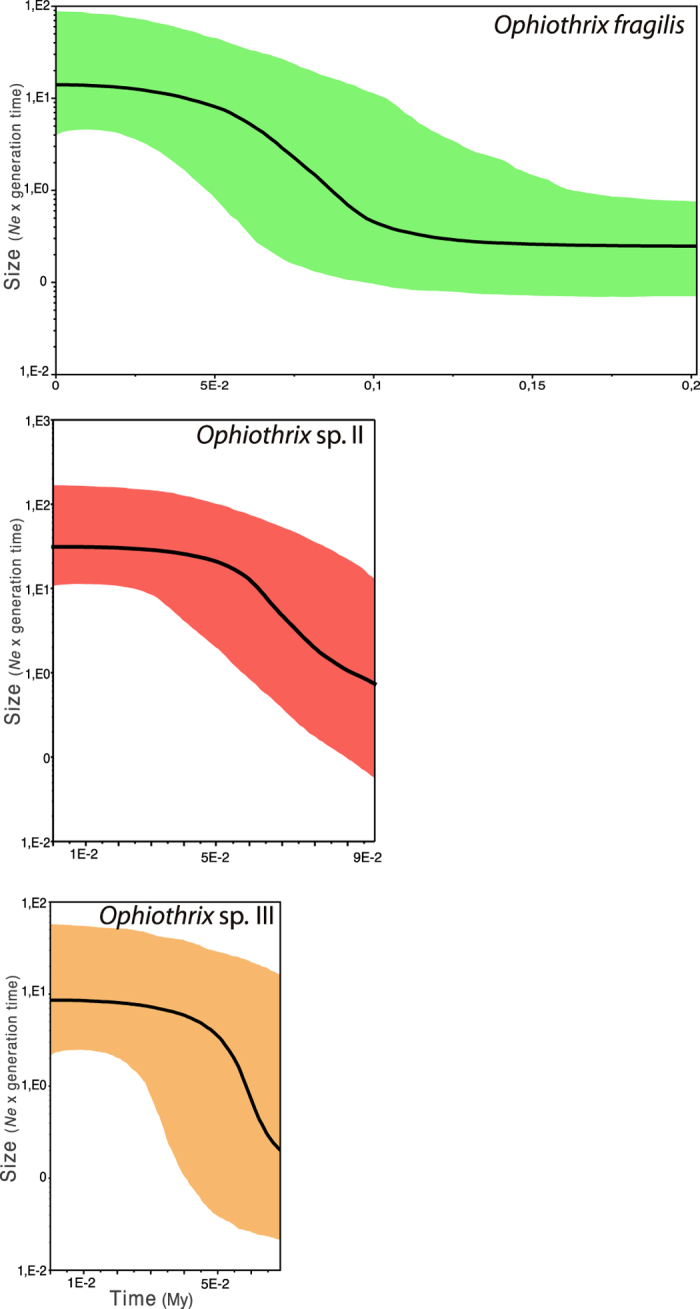
Figure 4. Demographic analyses of the three Ophiothrix species based on Bayesian Skyline plots of the 16S marker.

Time is measured in million years (Mya). Black lines illustrate mean size estimations, and colour shadows show 95% confidence interval.

Time is measured in million years (Mya). Black lines illustrate mean size estimations, and colour shadows show 95% confidence interval.