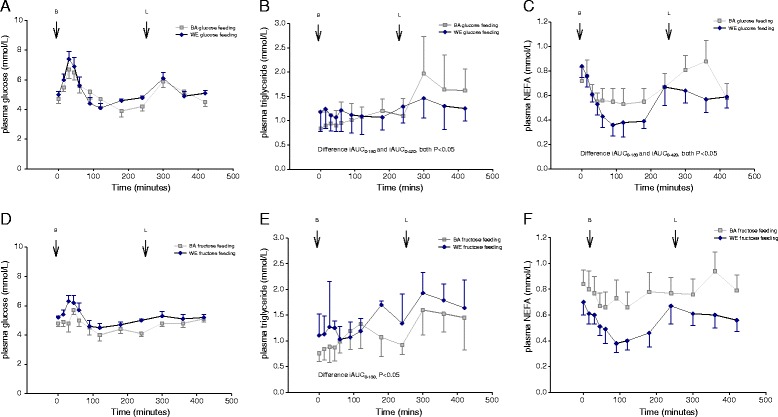
Fig. 1.

Serum glucose (a), TG (b) and NEFA (c) response to glucose-rich meals in BA (light square) and WE (dark diamonds) participants, and serum glucose (d), triglyceride (e) and NEFA (f) response to fructose-rich meals in BA (light square) and WE (dark diamonds) participants. Breakfast meal consumed at 0 min and lunch meal consumed following the 240 min sample. Point estimates are mean ± SEM for glucose and NEFA, and median (IQR) for triglyceride. Light squares: BA; dark diamonds; WE. BA, Black African; NEFA, non-esterified fatty acids; TG, triglyceride; WE, White European
