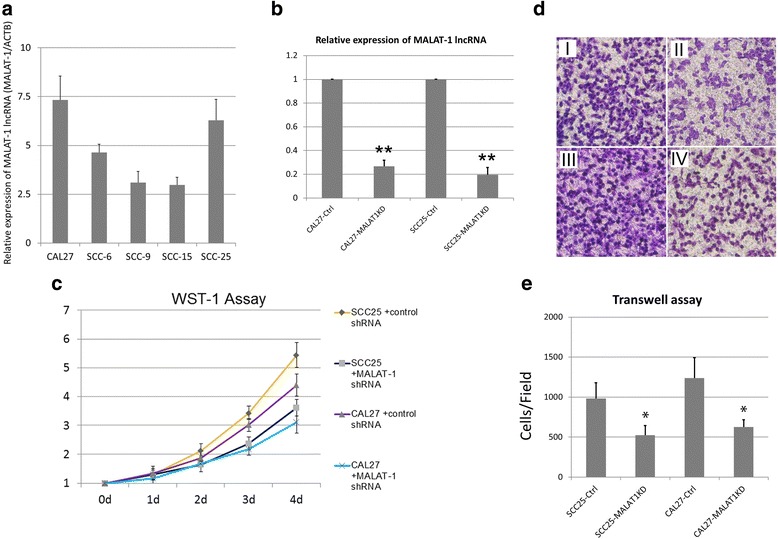
Fig. 2.

Knockdown of MALAT-1 lncRNA impaired proliferation and migration of TSCC cells in-vitro. a Expression levels of Malat-1 lncRNA were examined by real-time PCR. b After treatment of lentiviruses expressing MALAT-1 shRNA and control shRNAs, the expression levels of MALAT-1 lncRNA were examined by real-time PCR. The relative expression of Malat-1 lncRNA (as the ratio of Malat-1 lncRNA to β-actin mRNA) is illustrated as a ratio to control (cells transfected with nonsense siRNA). c WST-1 (Roche) assay measuring the activity of mitochondrial dehydrogenases was performed following the manufacturer’s instruction at 0-, 1-, 2-, 3-, 4- day time points. Error bars represent the standard deviation of the mean; d Cell migration was determined using a transwell assay as described in the Methods section. Microscopic image of migrated CAL 27 and SCC-25 cells with indicated treatments: (I) SCC25 + control shRNA; (II) SCC25 + MALAT1KD shRNA; (III) CAL27 + control shRNA; (IV) CA L27 + MALAT1KD shRNA; e Diagrams of migrating cells from the different transfectants are shown, which are from more than three independent experiments.*P < 0.05 versus control
