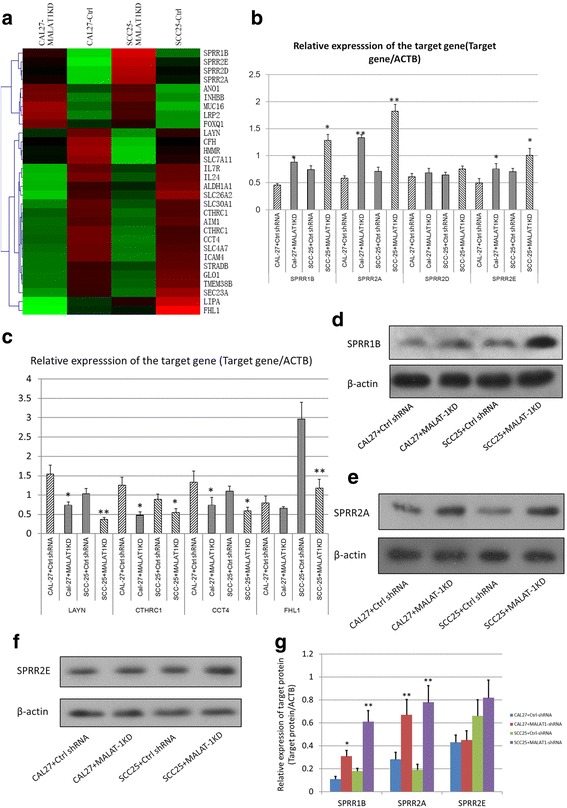
Fig. 3.

Knockdown of MALAT-1 leads to the enhanced expression of SPRR proteins. a The heatmap illustrated the genes most significantly influenced by KD of MALAT-1 using microarray analysis. b & c Real-time PCR analysis was carried out to examine the mRNA expression of selected genes screened by microarray analysis;*P < 0.05 versus control; **P < 0.01 versus control. d, e & f Western blotting was performed to examine the protein levels of SPRR1B, 2A &2E in CAL 27 and SCC-25 cells; β-actin was used as control. g The histogram shows the mean ± SD of the gray scale analysis, which were obtained from 3 independent experiments each group; *P < 0.05;**P < 0.01
