
Fig. 2.
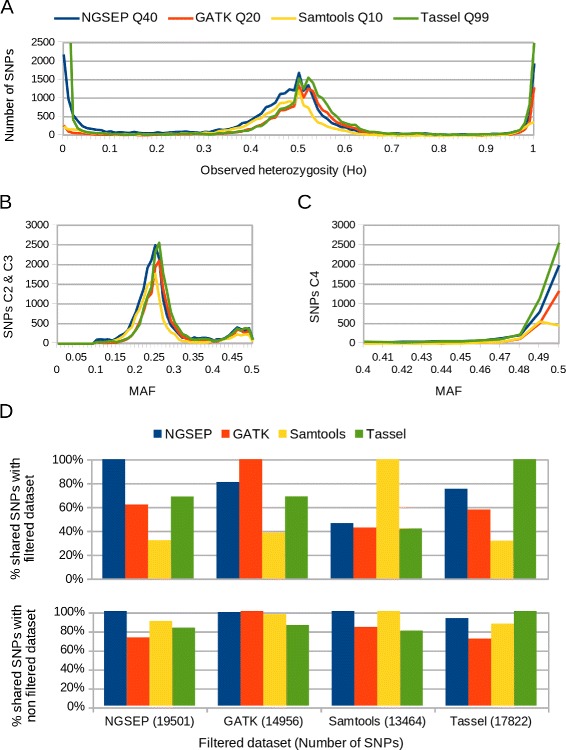
MAF and H o distributions. Statistics on filtered SNPs obtained running the four discovery pipelines compared in this study on the K family GBS data. a Distribution of observed heterozygosity b MAF distribution in SNPs useful to build a genetic map (categories 2 and 3, see Methods for details), c MAF Distribution on highly heterozygous SNPs (category 4), and d Percentage of filtered SNPs useful to build a genetic map that appear at the filtered (upper chart), and unfiltered (lower chart) datasets obtained running each method