
Fig. 3.
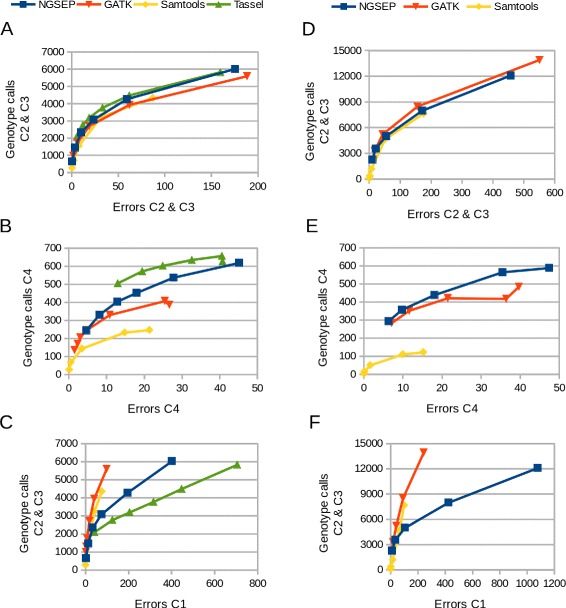
Quality assessment for cassava F1 families. Top figures: Number of genotype calls in SNPs classified in the categories that are useful to build a genetic map (C2 and C3, see Methods for details) contrasted with the number of segregation errors identified in such categories in a the K family and d the NxA family. Middle figures: Number of genotype calls in SNPs segregating the two parents (C4) contrasted with the number of (false) homozygous genotypes called in SNPs catalogued in this category in b the K family and e the NxA family. Bottom figures: Number of genotype calls in SNPs classified in the categories C2 and C3 contrasted with the number of genotyping errors identified in SNPs predicted to be monomorphic in c the K family and f the NxA family. For each pipeline the dots represent datapoints obtained filtering genotype calls at different minimum quality scores. Values in all figures are thousands of genotype calls