
Fig. 5.
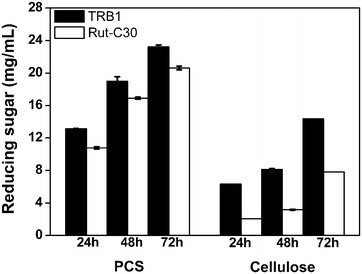
Saccharification of PCS and microcrystalline cellulose by T. reesei RUT-C30 and TRB1 using the equal culture supernatants. The error bars indicate the standard deviation of three biological replicates. The error bars indicate the standard deviation of three replicates, though in some cases they are too small to see on the graphical scale being use