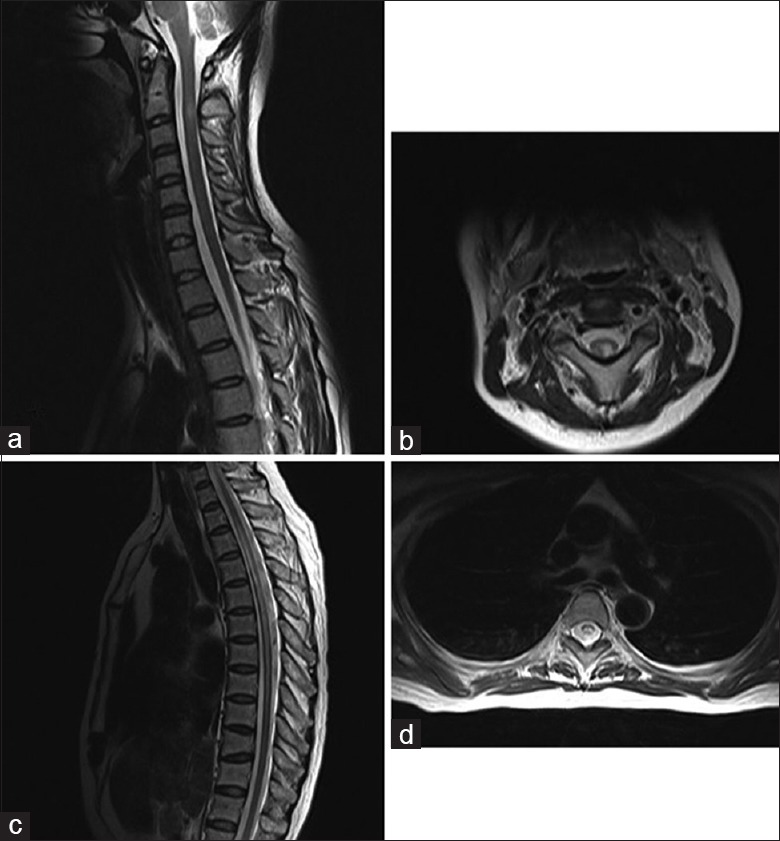
Figure 2.

Typical spinal cord lesions for multiple sclerosis (a and b) and neuromyelitis optica spectrum disorder (c and d). (a) The sagittal T2-weighted images showed hyperintensity within the cord with slight swelling at the upper cervical level. (b) T2-weighted axial images of the upper cervical region showed dorsolateral hyperintensity, which is typical in multiple sclerosis. Characteristic lesions for neuromyelitis optica spectrum disorder: (c) Spinal cord T2-weighted magnetic resonance imaging hyperintensities within a longitudinally extensive lesion. (d) Spinal cord magnetic resonance imaging axial T2-weighted image showed the gray matter-dominated involvement of “H”-shaped lesions.
