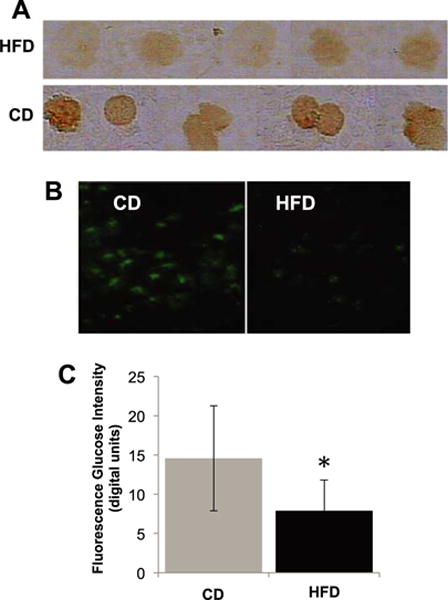
Fig. 3.

(A) Extracellular domain immunolabel density of the insulin receptor (same techniques as in Fig. 2). (B) Glucose uptake (non-hydrolyzable glucose analog 6-NBD-deoxyglucose; according to Methods described in [35]) in fresh isolated leukocytes after lysis of red blood cells from rats fed HFD and CD for 12 weeks with (C) digital fluorescent intensity measurements. The leukocytes were exposed to the fluorescent glucose analog for a period of 30 min. Note the reduced insulin receptor density and attenuated transmembrane glucose transport into the cells after exposure to plasma of rats on HFD compared to CD. *p < 0.05 HFD vs. CD by student t test. N = 4 rats/group.
