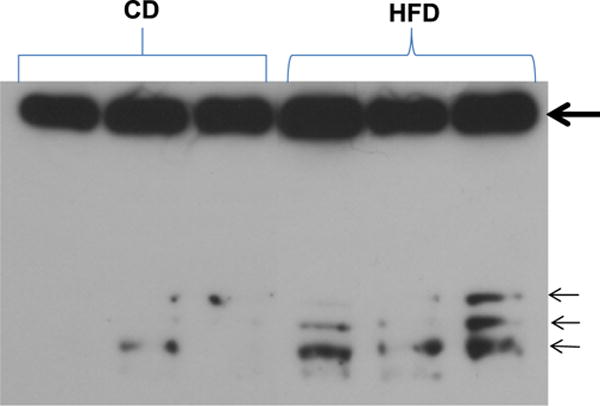
Fig. 4.

Western blot showing insulin receptor alpha in plasma of rats fed HFD and CD for 12 weeks. In addition to the expected upper band (thick arrow, 130 KDa), three additional bands (small arrows) are present in plasma of HFD rats and low or absent in the plasma of rats on CD. The bands indicate additional cleavage products of the insulin receptor alpha and require further mass-spec analysis. (Colors are visible in the online version of the article; http://dx.doi.org/10.3233/BIR-15045.)
