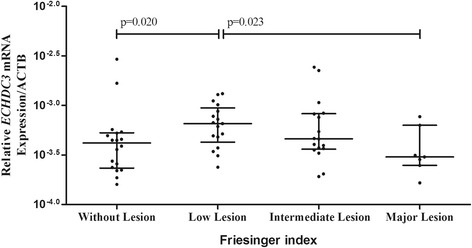
Fig. 1.

ECHDC3 mRNA expression relative to ACTB expression according to the extent of coronary lesion. Data are presented as median and interquartile range. Relative expression of ECHDC3 was calculated using the 2-deltaCT method. Statically analysis was performed by Kruskal-Wallis test followed by Mann Whitney test
