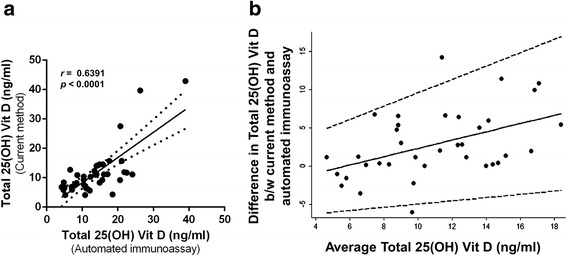
Fig. 1.

Comparative analysis of serum 25-hydroxyvitamin D measurement protocols. a Graph shows the correlation of serum total 25-hydroxyvitamin D [25(OH) Vit D] levels measured by manual direct competitive chemiluminescent enzyme linked immunoassay with PBS-based 25-hydroxyvitamin D3 standards; current method (y axis) and automated direct competitive chemiluminescent enzyme linked immunoassay (x axis). r - Spearman correlation; n = 36. b Bland-Altman plot showing the agreement between the two methods used to measure serum 25-hydroxyvitamin D. The average total 25-hydroxyvitamin D in the x-axis indicates the mean of serum 25-hydroxyvitamin D level measured by the current method using PBS-based 25-hydroxyvitamin D3 standards and by automated immunoassay
