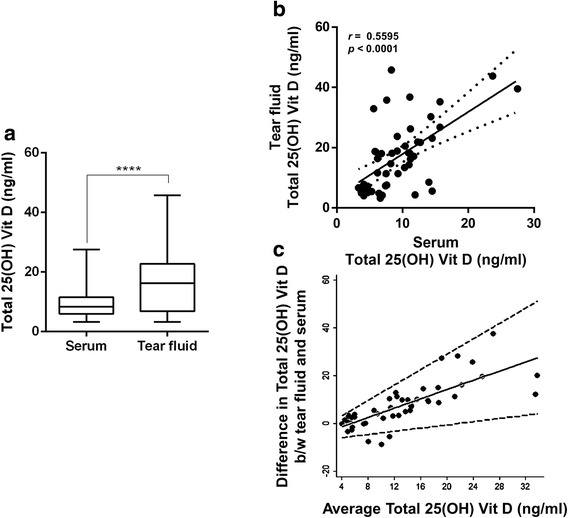
Fig. 2.

Correlative evaluation of total 25-hydroxyvitamin D levels in serum and tear fluid. a Box and whiskers plot indicating the median levels of total 25-hydroxyvitamin D measured in the serum and tear fluid. b Correlation between serum and tear total 25-hydroxyvitamin D [25(OH) Vit D] levels (n = 48), r - Spearman correlation. c Bland-Altman plot showing the agreement between tear and serum 25-hydroxyvitamin D levels. The average total 25-hydroxyvitamin D in the x-axis indicates the mean of tear and serum 25-hydroxyvitamin D levels. n = 48; ****p < 0.0001, Wilcoxon matched-pairs signed rank test
